Imperial Sugar Company Actual and Projected Operations: September 1971
Page:
1 of 2
[1] p. ; 28 cm.
View a full description of this report.
These controls are experimental and have not yet been optimized for user experience.
The following text was automatically extracted from the image on this page using optical character recognition software:
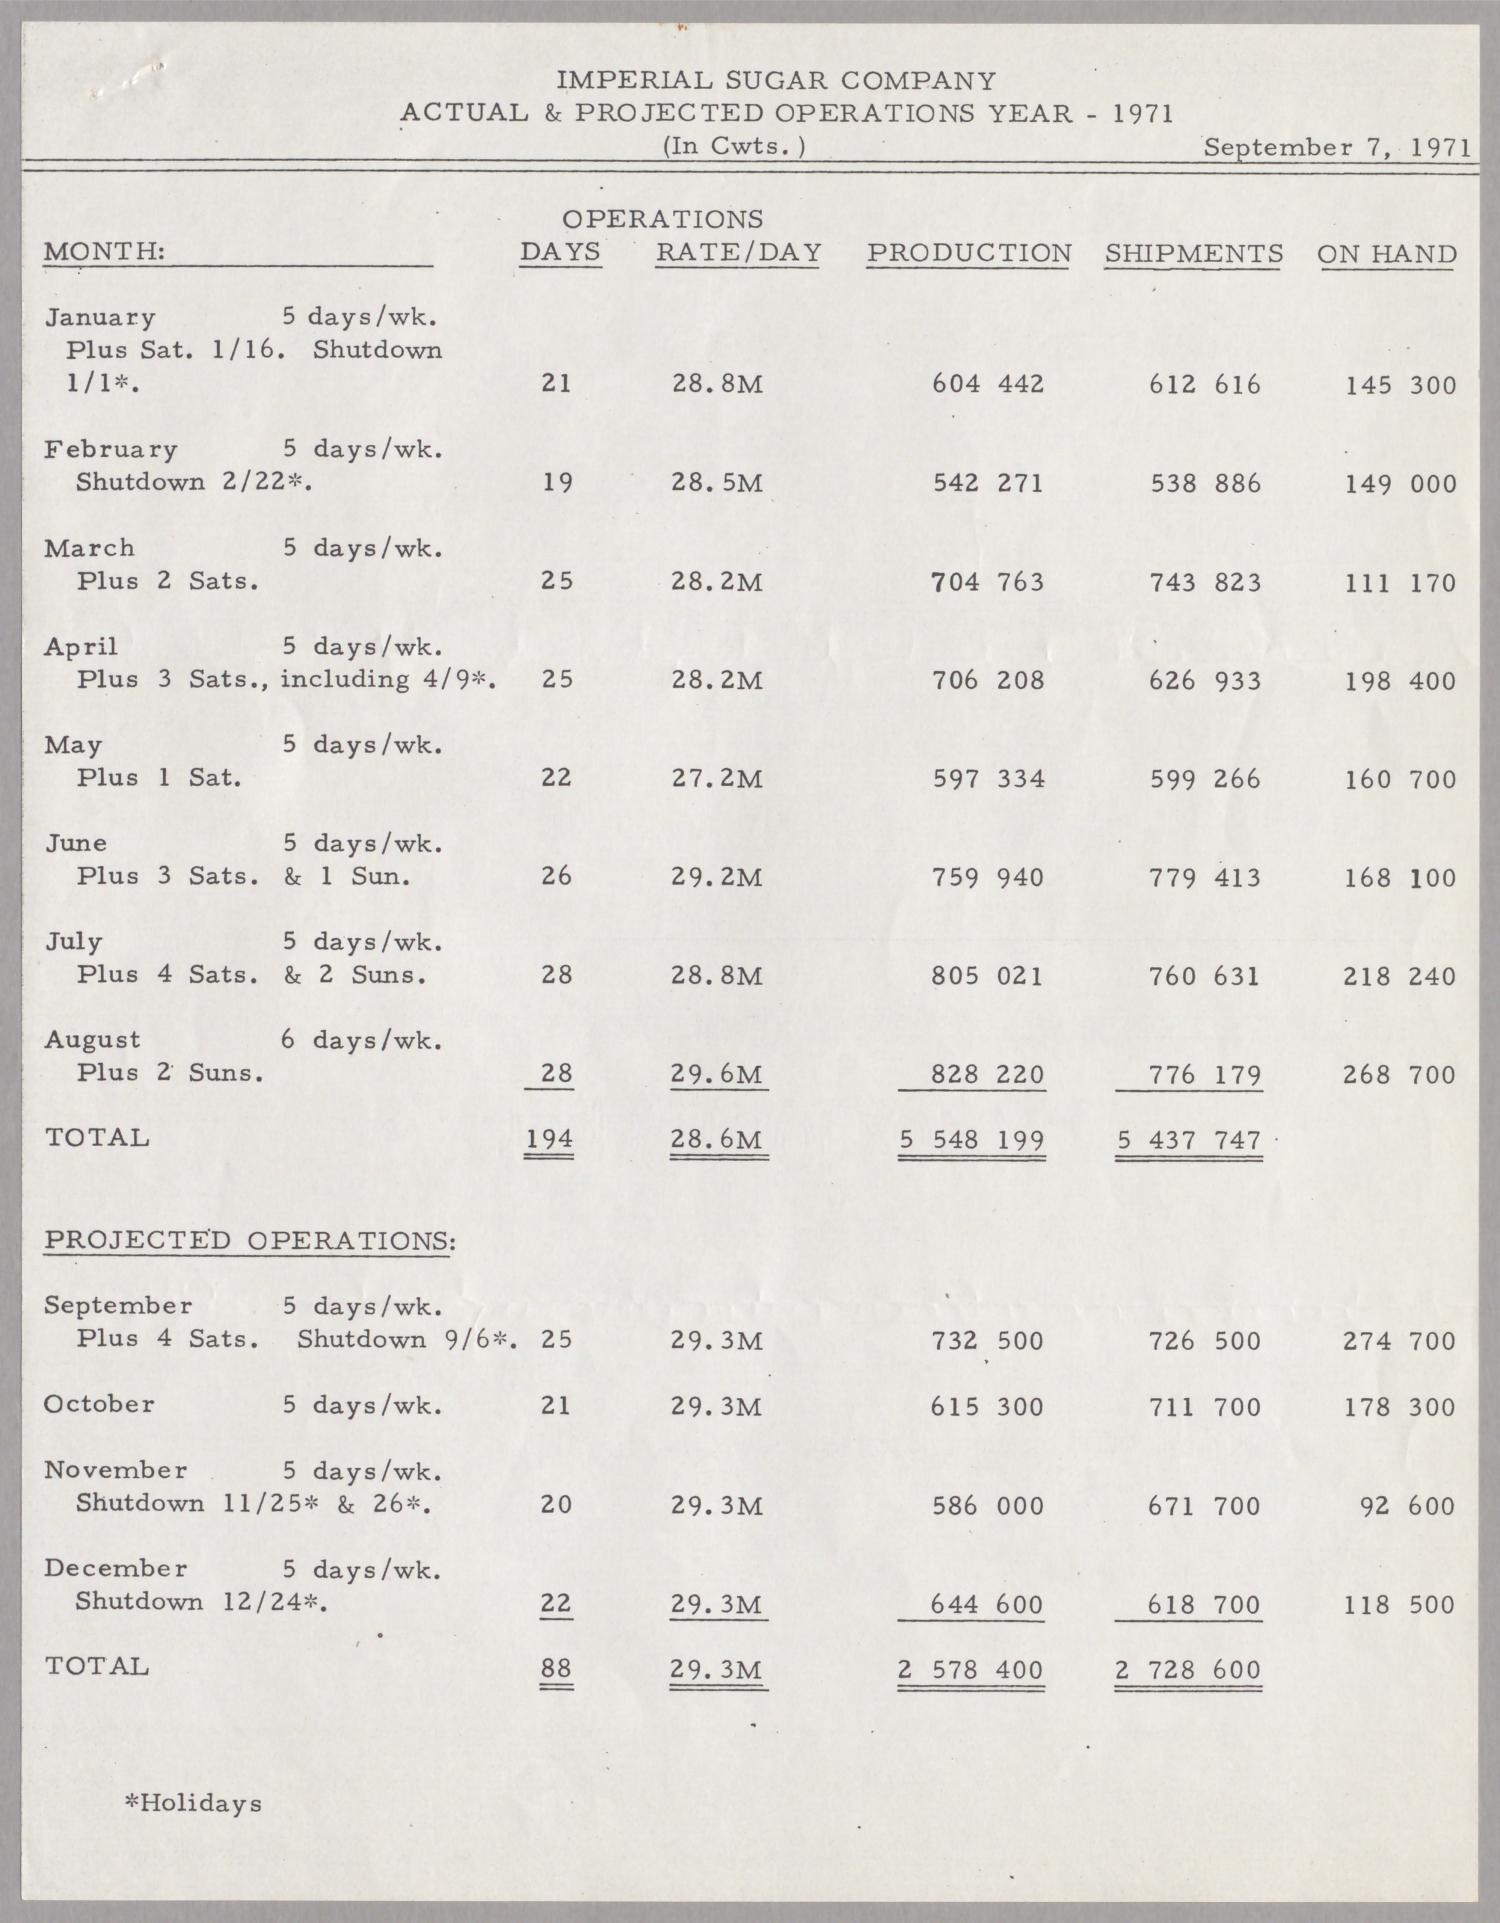
                                IMPERIAL SUGAR COMPANY
ACTUAL & PROJECTED OPERATIONS YEAR - 1971
(In Cwts. )               September 7, 1971

MONTH:
January        5 days/wk.
Plus Sat. 1/16. Shutdown
1/1*.
February       5 days/wk.
Shutdown 2/22*.

March
Plus 2 Sats.

5 days/wk.

April          5 days /wk.
Plus 3 Sats., including 4/9*.

May
Plus 1 Sat.

5 days/wk.

June            5 days/wk.
Plus 3 Sats. & 1 Sun.
July            5 days /wk.
Plus 4 Sats. & 2 Suns.

August
Plus 2 Suns.

TOTAL

OPERATIONS
DAYS  RATE/DAY

21
19
25
25
22
26
28

6 days/wk.

28
194

28. 8M
28. 5M
28.2M
28. 2M
27. 2M
29. 2M
28. 8M
29. 6M
28. 6M

PRODUCTION

604 442
542 271
704 763
706 208
597 334
759 940
805 021
828 220
5 548 199

SHIPMENTS

612 616
538 886
743 823
626 933
599 266
779 413
760 631

776 179
5 437 747

ON HAND

A

145 300';

149 000

111 170
198 400
160 700  '
168 100
218 240

268 700

PROJECTED OPERATIONS:

September

5 days/wk.

Plus 4 Sats.  Shutdown 9/6*.

October

5 days/wk.

November      5 days/wk.
Shutdown 11/25* & 26*.

December

5 days /wk.

Shutdown 12/24*.

TOTAL

25
21
20
22
88

29. 3M
29. 3M
29. 3M
29. 3M
29. 3M

732 500
615 300
586 000

644 600
2 578 400

726 500
711 700
671 700

618 700
2 728 600

*Holidays

Ail

274 700
178 300
92 600
118 500

_-_LI_.kgL
Search Inside
This report can be searched. Note: Results may vary based on the legibility of text within the document.
Tools / Downloads
Get a copy of this page or view the extracted text.
